Are you tracking a ton of metrics but still feel like you’re flying blind?
If so, you’re not alone. I see it all the time. Owners buried in dashboards, spreadsheets, and reports, but still asking:
“Are we winning?”
“Where are we off track?”
“What should I do next?”
Despite all the data, the business still feels fuzzy. You don’t have a data problem. You have a clarity problem.
Too often, businesses are tracking too much, the wrong stuff, and far too late.
So today, let’s fix that.
Let’s talk about how to choose KPIs that actually drive decisions and show you the truth about your business.
THE REAL JOB OF KPIS
A KPI’s only job is to help you make better decisions.
Not to “look smart.”
Not to “be thorough.”
Not to “satisfy the bank.”
If a KPI doesn’t directly connect to a decision you can make, it’s noise. That’s why most KPI systems break.
We start measuring things because someone said it was a “best practice” or we saw it in a book or on LinkedIn. Then we end up with dashboards that look great but don’t change how we act.
Clarity dies in complexity.
To rebuild it, we need to understand the six types of KPIs — and how they work together.
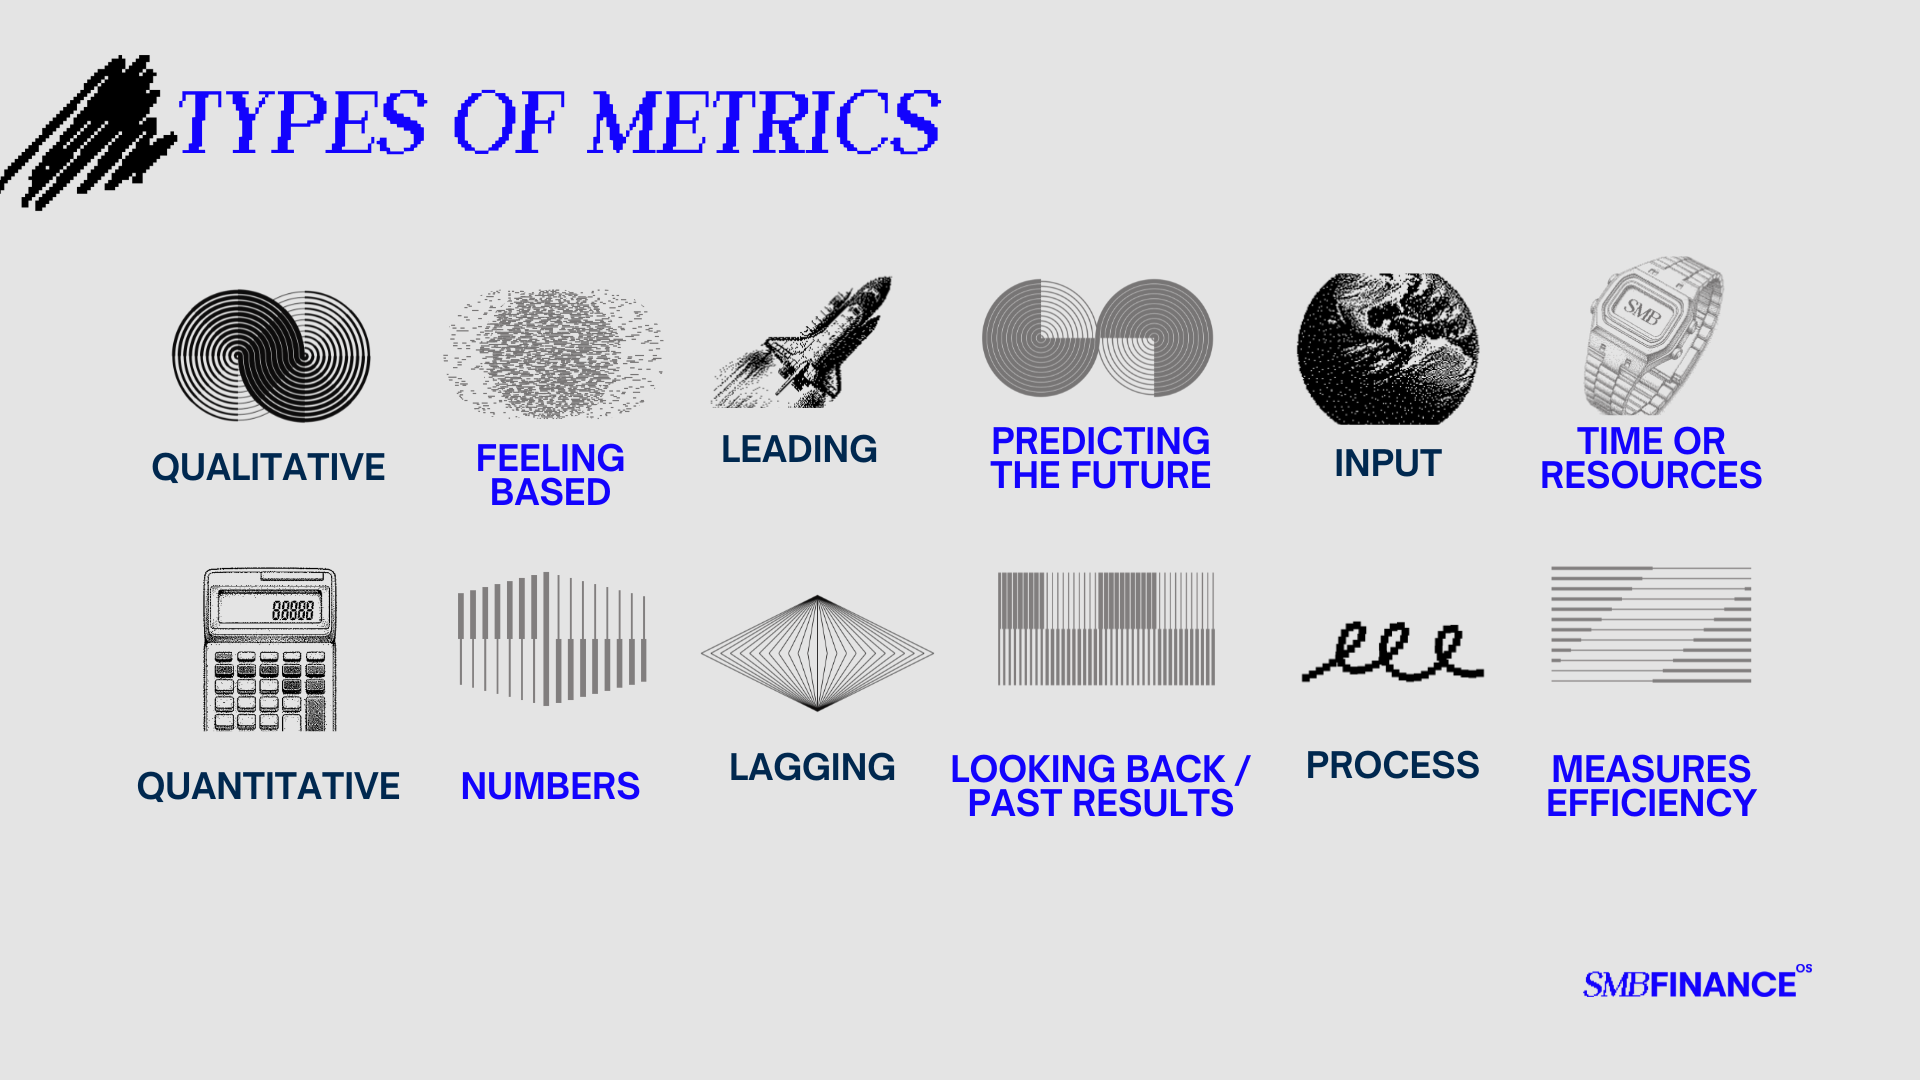
THE SIX TYPES OF KPIs
Every metric fits into a few natural pairings. These pairs form the “language” of how your business performs.
Qualitative vs. Quantitative
Qualitative = what people feel. Example: a customer satisfaction survey or employee feedback score.
Quantitative = what you can count. Example: the number of sales calls, the dollar value of closed deals.
Great KPI systems bridge the two, taking feelings and converting them into something measurable.
Leading vs. Lagging
Leading metrics predict what’s going to happen.
Lagging metrics tell you what already happened.
Sales calls (leading) drive revenue (lagging). When you understand that chain, you stop being surprised by your results.
Input vs. Process
Input = the raw effort or resources you put in (hours worked, units made, dollars spent).
Process = how efficiently that input gets converted into output.
Example: 40 hours worked → 30 billable → 75% utilization → revenue. That ratio becomes a powerful predictor of future results.
—
When you combine these lenses, you stop staring at disconnected numbers and start seeing systems: inputs turning into processes, processes producing outcomes, outcomes validating your decisions.
That’s the entire point of KPIs: to make the system visible.
HOW TO CHOOSE THE RIGHT KPIS
Once you understand the types, you can finally answer the most important question: What actually drives my business forward?
We’ll do this in three steps:
- Start with your financial statements. Look for your biggest levers: revenue, margins, cash flow. Those are your lagging indicators: the results you want.
- Trace backward from the results. If your lagging metric is revenue, what drives it? Maybe sales calls, marketing spend, referral volume. If it’s gross profit, what drives that? Pricing, discounts, production efficiency, utilization. Keep walking backward until you reach the first action in the chain. The thing that initiates the process.
- Connect the chain. Every lagging KPI should have a leading partner. Every leading KPI should have a measurable outcome.
Example: “100 sales outreaches → 25 calls → 5 proposals → 3 closes → $75,000 in new revenue.”
If that chain breaks, say outreach stays flat but revenue drops, you now know where to look (outreach or sales call conversions), not just that it happened.
BUILDING A SYSTEM THAT WORKS
Here’s the process I teach our clients to follow:
- Identify the driver. What’s the key action or variable that truly moves the business?
- Select the KPI. What’s the cleanest, most direct measure of that driver?
- Decide your cadence. Leading metrics get tracked more frequently (daily or weekly). Lagging metrics can be monthly or quarterly. This gives you a continuous feedback loop, not just a month-end snapshot.
- Create a push system. Numbers only matter if they’re reviewed. Make sure you set the system so you can’t miss it. Automate dashboards, alerts, or recurring meetings so the right people see the right numbers at the right time.
- Track and adapt. You won’t get it perfect on the first try. That’s normal. Watch how each KPI performs and refine it until it reliably predicts results.
When done well, this process will leave you with just 3–5 KPIs that actually matter. That’s it. They’ll become the heartbeat of your business that tells you where to focus every week.
YOUR NEXT STEPS
If your metrics feel like static, go back to the foundation. Start with your goals. Identify your true drivers. Build your KPI chain from input → process → output → result.
Clarity and consistency are the game. Get 5 KPIs that matter and repeatedly look at them.
As Fractional CFOs, we see this every day at Bison CFO. Our job is to not flood you with data, but help you see the signal in the noise.
Ultimately, the job is to help you get clearer data so you can make clearer decisions.
We make sure the things being tracked actually help you run the business better, not just check boxes.
The cohort, 5 Days to Financial Clarity, will do the same thing.
This is a portion of the teachings on day 2 and 3.
So, if you want help building the system we use to help businesses transform their finances, join us for our upcoming 5 Days to Financial Clarity Cohort.
We’ll walk you step-by-step through identifying your true financial drivers, connecting them to the right KPIs, and designing a rhythm that turns data into decisions.
We guarantee it’ll help you find clarity, or we’ll refund your money.

